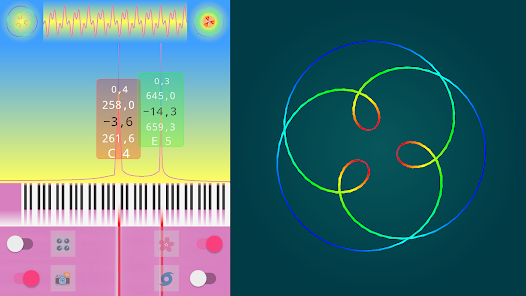
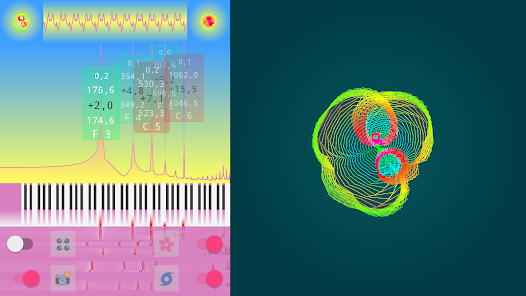
Surprisingly, there are strict mathematical methods that literally allow to hear visual geometric forms and, conversely, to see the beauty of musical harmonies...
Research in this area was inspired by mathematical videos from the channel «3Blue1Brown»:
Turns out, it is possible with Fourier transform to encode vector-based visual images of high complexity, via decomposing them into harmonic components based on complex vector-numbers, which is clearly demonstrated into the above-mentioned videos and the encoding algorithm is described in more details into lections from channels «Mathologer» and «The Coding Train»:


There are more examples with other images by request «epicycle drawing Fourier transform».
But also with Fourier transform it is simple to extract harmonic components from signals of various nature, for example, acoustic... Immediately intriguing questions arise: what if we apply the presented approach for research of signals?
How would be look sounding of a guitar string, another musical instruments, voice, different sounds?
And vice versa
How would be sound different visual forms of complex numbers geometry?
In order to reveal and explore in details these mysterious questions, it has been decided to implement appropriate visualization modules on base of SOLFEGGIO app for musical spectral analysis...
At the current moment two branches of the app are available: desktop for Windows [Microsoft Store, One Drive] and mobile for Android [Google Play]. The versions are very similar in functionality, but usually the desktop version is a little faster and more convenient for experiments, and also contains an additional powerful visualization module «Tape 3D», which is missing in the mobile version.


To see sounds seriously, create three-dimensional geometric shapes with your voice and even fly into them, it is recommended to download the application, master basic skills and work directly with it. The program is free for educational and non-commercial use. In a case of commercial targets a donation of any size(in good faith) must be performed.
Also worth mentioning, that the app, source codes, results of researches and other related materials suggested for peaceful use (see for details the agreement).
HOW TO USE THE PROGRAM?
So, now let's start our research. To intuitively understand how the various visualization methods work, firstly consider a single sine wave-based signal. For this:
go to «Signal» section and choose «Generator» profile
open «Generator» section and choose «Camertone» profile

After completing these steps, you should hear a pure sine tone at the specified frequency (440 Hz by default) from your speakers. A circle will appear on the flower visualization, and an Archimedean spiral will appear on the spiral visualization. If you play with the frequency of the tone, the number of turns of the spiral will change, the value of the tone magnitude will affect on its radius.
Now, if you fly slightly to the side in a 3D visualization, you can find a ribbon-spring, the vertical projection of which onto the horizontal plane forms the source sinusoid.

Here need to mark a record on a channel «Physics Videos by Eugene Khutoryansky», in which the same method of three-dimensional visualization is considered:
If you start adding additional sinusoids of different frequencies and magnitudes to a single sinusoidal tone, then the patterns in the flower and spiral visualizations will begin to change significantly. It is important to note: although the spring ribbon will begin to twist into fancy lace curls (depending on the ratios of frequencies and magnitudes), in three-dimensional representation its projection onto the horizontal plane will still correspond to the original time frame.


If you look at the springs exactly from the end, then the orthonormal projection will represent a circular floral geometry (this is the method used for drawing in the video channel «3Blue1Brown»), while how the perspective projection will form spiral shapes.
The variety of forms is extremely large (flowers, mandalas, lambs and many others), but significant that pure musical harmonies usually form easily readable patterns... Also by these patterns it is possible to distinguish the timbre color of various musical instruments and voices sounding on the same note.

It is interesting that patterns can be both static and dynamic in nature, for example: rotating, pulsating, shimmering and flowing in a fascinating way.
HOW IT WORKS?
At a first approximation, there is a following algorithm:
take a short piece of audio signal with a duration of about 100 ms (time frame);
find pure sinusoidal tones (frequencies) sounding in the signal, calculate their magnitude and phase shift with help of the Fourier transform;
after construct and draw geometry based on this information.
But upon closer examination, everything becomes a little more complicated: the computational discrete fast Fourier transform (FFT) algorithm has some peculiarities that make high-precision signal analysis difficult. To eliminate these difficulties, the phase-magnitude interpolation (PMI) algorithm is additionally used, which is described in more details in the article RIDDLES OF THE FAST FOURIER TRANSFORM.
As for the final geometric constructions, they are based on the following algorithm in a programming language C#:
	public class GeometryPresenter
	{
		public static IEnumerable<Point> Draw(
			IList<Bin> peaks, int sampleSize, double sampleRate,
			double approximation = 1d, double spiralStep = 0d, double phaseAngle = 0d
			)
		{
			if (peaks.Count.Is(0))
				yield break;

			var spiralScale = 1d;
			var pointsCount = (int)(sampleSize / approximation);

			for (var i = 0; i < pointsCount; i++, spiralScale -= spiralStep)
			{
				var a = 0d;
				var b = 0d;

				for (var j = 0; j < peaks.Count; j++)
				{
					var peak = peaks[j];
					var w = Pi.Double * peak.Frequency;
					var t = 2d * i / sampleRate * approximation;
					var phase = peak.Phase + w * t + phaseAngle;
					var magnitude = peak.Magnitude * spiralScale;

					a += magnitude * Math.Cos(phase);
					b += magnitude * Math.Sin(phase);
				}

				yield return new(a, b);
			}
		}
	}
The source code of the 3D visualization algorithm is available link.
FOR REFLECTION
Although time frames of signals are often presented in two dimensions, the Fourier transform allows to expand them into three dimensions and show from previously inaccessible angles, which makes it possible to research hidden intricate geometric patterns and match them with an exact acoustic equivalent.
This is reminiscent of holographic photographs and stereoscopic pictures, when flat images, when viewed correctly, magically acquire volume.
Also, photoholograms and time frames of signals have another similar property: due to the fact that each piece of the hologram partially stores information about the entire scene when it is divided (to a certain limit) it is still possible to view the original scene in each individual piece, but from fewer angles. Like, when the window in the room is partially covered, the picture on the street is still visible, although in order to see it you need to come closer to the window or move a little to the side. Similarly, when reducing the size of the time frame of the signal, it remains possible to recognize the original «scene» from harmonics with less accuracy.
MIRRORS OF THE ARTICLE
ADDITIONAL MATERIALS